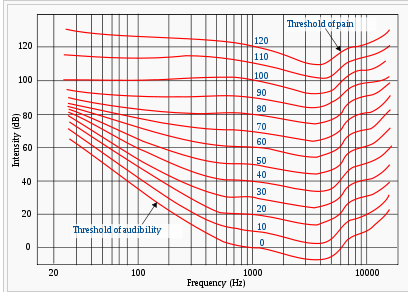
The Fletcher Munson Curve illustrates how human hearing sensitivity varies with frequency. It shows that ears perceive different frequencies at varying loudness levels.
Understanding the Fletcher Munson Curve is critical for audio professionals, highlighting the intricacies of human auditory perception. This knowledge is paramount when mixing music or calibrating sound systems to ensure that audio experiences are both pleasant and accurate. The curve emphasizes that our ears are most sensitive to frequencies between 2kHz and 5kHz, roughly the range of human speech, and less sensitive to very low and very high frequencies.
By considering this curve, sound engineers can create truly lifelike soundscapes, tailoring output to fit our natural hearing tendencies. It’s a foundational concept in the fields of acoustics, audio engineering, and psychoacoustics, guiding experts in creating sound that complements the human hearing system.
The Fletcher Munson Curve Unveiled
Discover the wonders of the Fletcher Munson Curve as we unveil its mysteries.
Origins And History
The Fletcher Munson Curve comes from deep audio history. Two scientists, Harvey Fletcher and Wilden A. Munson, presented it in 1933. This curve shows how we hear sounds differently at various frequencies and volumes. It became a cornerstone for understanding human hearing. This discovery shapes how we design sound systems and spaces.
Key Principles
At its core, the Fletcher Munson Curve maps human hearing sensitivity. It reveals a key fact: we don’t hear all frequencies equally. Loudness impacts our perception.
- Equal Loudness Contours: The curve forms part of these contours. They show how we need different levels of power to hear frequencies as equally loud.
- Volume Variation: Our hearing is most sensitive to frequencies between 2 kHz to 5 kHz. This changes with volume.
- Frequency and Loudness: Low and high frequencies need a louder sound to be heard well, unlike mid-range frequencies.
The Physics Of Sound And Human Hearing
Understanding how we hear is a journey into physics and biology. Our ears translate air vibrations into sounds. This transformation involves complex processes. The Fletcher Munson Curve explains how we perceive loudness at different frequencies. Read on to explore the intricate connection between sound waves and our auditory perception.
How We Hear
Our hearing starts when sound waves enter the ear canal. These waves make the eardrum vibrate. Behind the eardrum, tiny bones in the middle ear also vibrate. These vibrations move to the inner ear. The inner ear has a snail-shaped part called the cochlea. It is filled with fluid and lined with tiny hairs. As the fluid moves, the hairs send electrical signals to the brain. The brain tells us what we are hearing.
Frequency And Amplitude
Sound waves have two important parts: frequency and amplitude. Frequency decides the pitch of a sound. High frequency means a high pitch, like a bird singing. Low frequency means a low pitch, like a drum. Amplitude decides how loud a sound is. A sound wave with high amplitude is loud, like a shout. Low amplitude is quiet, like a whisper. The Fletcher Munson Curve shows that our ears hear different frequencies at different loudness levels.
| Frequency | Corresponding Pitch |
|---|---|
| High | High pitch (e.g., bird chirping) |
| Low | Low pitch (e.g., drum beat) |
| Amplitude | Loudness Perception |
|---|---|
| High | Loud (e.g., shouting) |
| Low | Quiet (e.g., whispering) |
The cochlea is more sensitive to some frequencies. At normal listening levels, mid-range frequencies around 500 Hz to 3 kHz are the clearest. Sounds at these frequencies seem louder than high or low pitches at the same amplitude.
Decoding The Curve
Let’s dive into the fascinating world of how we perceive sound. The Fletcher Munson Curve is a key to understanding that. This curve shows how our ears hear different frequencies at varying loudness levels. Here’s a closer look at what this curve tells us.
Equal Loudness Contours
These contours are essential for grasping the Fletcher Munson Curve. Imagine lines that represent sounds heard at the same volume. Our ears are unique. They don’t hear all frequencies at the same level. This curve reveals this remarkable trait. It maps out many lines for different loudness levels. Each line is an equal loudness contour.
- The curves flatten as the volume increases.
- Human ears are most sensitive to frequencies between 2kHz to 5kHz.
- Lower and higher frequencies need to be louder for us to perceive them as equal.
Frequency Response And Perception
Now, let’s unpack frequency response and perception. Our hearing sensitivity changes with frequency and loudness. For example:
| Frequency | Loudness | Perception |
|---|---|---|
| Low | Quiet | Hard to Hear |
| Midrange | Quiet | Clear |
| High | Quiet | Hard to Hear |
| Low | Loud | More Audible |
| High | Loud | More Audible |
This table presents a snapshot. It simplifies our complex hearing abilities. Music producers and audio engineers must understand this. It helps them create sounds that we hear clearly and comfortably at all volumes.
Credit: www.phasure.com
Practical Applications In Audio Engineering
The Fletcher Munson Curve is a key tool in audio engineering. It shows how we hear sounds at different volumes. Engineers use this knowledge to make music sound great on any device.
Mixing And Mastering
Mixing and mastering are vital for producing quality audio. Here’s how the Fletcher Munson Curve helps:
- Ensures consistent sound levels across frequencies.
- Helps balance tracks for human ears at various volume levels.
- Avoids ear fatigue during long listening sessions.
Using the curve, engineers make sure the mix is pleasing at every volume.
Room Acoustics Optimization
Knowing the Fletcher Munson Curve aids in designing better listening spaces. Look at how:
- Speakers are arranged for even sound at all angles.
- Materials are chosen to enhance the right frequencies.
- Noise levels are minimized for accurate sound reproduction.
Experts adjust rooms for the flattest frequency response, considering the curve.
The Listener’s Environment
Understanding the Fletcher Munson Curve becomes crucial when considering the listener’s environment. This curve illustrates how humans perceive loudness at different frequencies. The environment where we listen to sounds can dramatically alter our auditory experience.
Impact Of Background Noise
Background noise can affect our perception of sound. It can mask certain frequencies. This makes listening more challenging. The noise competes with the audio we intend to hear. For example, a bustling cafe might drown out the lower frequencies of music, or the hum of an air conditioner may cover subtle high-frequency sounds in a podcast.
- Home settings often have quieter backgrounds.
- Public places feature varied noise levels.
- Work environments can mix unpredictable sounds.
Adjusting Audio For Different Spaces
Different spaces require audio adjustments. Sound engineers must consider the Fletcher Munson Curve to maintain sound quality across various environments. They use it to balance audio levels so that listeners enjoy a consistent experience.
- Identify the typical noise profile of the space.
- Adjust treble and bass to compensate for background noise.
- Use equalization techniques to maintain audio fidelity.
Suitable audio settings for quiet rooms differ from those for noisy gyms. In quieter surroundings, a flat equalizer setting may suffice. In louder areas, boosting certain frequencies helps the primary audio cut through the noise. This delivers a clearer listening experience.
Hearing Health And Safety
Our ability to hear is precious, yet often overlooked. The Fletcher Munson Curve is crucial to understanding how we perceive different frequencies. This curve shows that our ears have varying sensitivity to sounds at different pitches. For hearing health and safety, knowing how to protect our ears is essential. Loud sounds can harm our hearing, but we can take steps to prevent damage.
Protecting Against Hearing Loss
Hearing loss can be due to loud noise exposure. Simple habits can keep our ears healthy. Below are key strategies to protect your hearing:
- Use Earplugs: During loud events, earplugs reduce noise levels.
- Limit Exposure: Spend less time in noisy environments.
- Follow the 60/60 Rule: Use headphones at no more than 60% volume for 60 minutes a day.
- Regular Check-Ups: Get your hearing tested often.
Safe Listening Levels
To maintain good hearing health, stick to safe listening levels. The Fletcher Munson Curve helps identify safe levels for different frequencies. Generally, sounds under 70 decibels (dB) are safe. Here’s a guide to follow:
| Environment | Safe Duration |
|---|---|
| Bird calls (40-50 dB) | No limit |
| Normal conversation (60-70 dB) | No limit |
| City traffic (80-85 dB) | Less than 2 hours |
| Concerts (100-110 dB) | Less than 15 minutes |
Always choose sounds that are gentle to your ears. Use sound level apps to check noise in your environment. Keep volume down on your devices. With the right care, you can enjoy sounds for a lifetime.
Advancements In Audio Technology
The journey of audio technology has been a symphony of innovation. From the vinyl era to the streaming age, our understanding of sound has greatly evolved. One pivotal discovery in this adventure was the Fletcher Munson Curve. This curve reveals how human ears perceive loudness at different frequencies. Fast forward to today, and this knowledge shapes how we experience sounds. Let’s dive into the recent advancements in audio technology sculpting the world of sound.
Modern Equalization Techniques
Equalization, or EQ, has undergone a remarkable transformation. Modern equalizers now tap into the Fletcher Munson Curve to create more nuanced soundscapes. By understanding that different frequencies require varying loudness levels for clarity, EQ technology offers precise control. DJs, producers, and audiophiles alike can sculpt audio with incredible detail. They adjust frequencies to ensure music sounds great at any volume.
- Parametric EQs: Allow users to pinpoint and adjust specific frequency ranges effortlessly.
- Dynamic EQs: They dynamically adapt to audio signals for real-time balance and consistency.
- Linear Phase EQs: These preserve the time relationship between frequencies, preventing phase issues.
Together, these tools employ the Fletcher Munson Curve intelligently. They make listening a pleasure at any decibel.
Smart Audio Systems
Smart audio systems are the new era maestros. They learn and adapt to their environment for optimal sound performance. Incorporating the Fletcher Munson Curve, these systems:
| Tech Feature | Function |
|---|---|
| Automatic calibration | They analyze room acoustics and adjust settings. |
| Adaptive sound control | They detect ambient noise levels and modify audio accordingly. |
| User profiling | Systems create sound profiles based on user listening habits. |
Smart audio systems ensure that whether in a quiet study or a noisy gym, the audio quality remains consistently exceptional. By considering human auditory perception, they deliver a personalized, immersive listening experience.
Future Directions
Exploring the future directions of the Fletcher Munson Curve reveals fascinating advancements. The curve outlines how we perceive different frequencies at varying volumes. It acts as a guide for creating balanced sounds. As technology evolves, so does our understanding and application of this fundamental audio principle. Two exciting frontiers stand poised to revolutionize how we experience sound: personalized sound experiences and the role of AI in audio.
Personalized Sound Experiences
Imagine audio that adapts to your hearing. Personalized sound experiences aim to do just that. Headphones and speakers will soon calibrate sounds based on individual hearing profiles. This means a richer, more nuanced listening experience for everyone. Here’s how this could look:
- Bespoke Equalization: Sound devices will tune frequencies to match your personal hearing sensitivities.
- Hearing Health Tracking: Devices could monitor hearing changes and adjust profiles accordingly.
- Environment Adaptation: Audio setups will optimize output considering ambient noise levels.
The Role Of Ai In Audio
Artificial Intelligence (AI) is steadily transforming the audio industry. AI algorithms can now learn and predict the Fletcher Munson Curve preferences for different listeners. The result? Smarter audio delivery systems that enhance the listening experience in real-time. Below are the roles AI will play:
| Function | Impact |
|---|---|
| Real-time Sound Adjustment | AI modifies audio levels instantly to ensure optimal listening at all times. |
| Frequency Personalization | Understands and adapts to your unique hearing curve for customized sound. |
| Audio Restoration | Enhances old or low-quality recordings to match modern listening standards. |
These developments hint at an audio future where listening becomes an individualized, dynamic experience.
Frequently Asked Questions Of Fletcher Munson Curve
What Is The Fletcher Munson Curve?
The Fletcher Munson Curve illustrates how human ears perceive loudness at different frequencies. It shows that our sensitivity to sound levels varies with frequency and that we’re less sensitive to low and high frequencies at lower volumes.
Why Is The Fletcher Munson Curve Important?
This curve is crucial for audio engineering because it guides equalization and mixing practices. By understanding it, engineers can create sounds that maintain consistent perceived loudness, enhancing the listener’s experience across different environments.
How Does The Fletcher Munson Curve Affect Hearing?
The curve affects hearing by indicating that louder sounds are perceived more flatly across frequencies, while at lower volumes, listeners may not hear low and high frequencies as well. This impacts how we perceive sounds daily.
Can The Fletcher Munson Curve Improve Sound Quality?
Yes. By applying knowledge of the curve, audio professionals can adjust sound systems to compensate for the human ear’s non-linear response, achieving a more balanced and pleasant sound at various listening levels.
Conclusion
Understanding the Fletcher Munson Curve is crucial for anyone passionate about sound. It reveals why we perceive frequencies differently at various volumes. By leveraging this insight, audio engineers can create balanced mixes, and music lovers can enjoy sound fully. So, embrace this knowledge, and tune in to an enhanced audio experience.