
Compression meters show what a compressor is doing to your signal, and learning to read them makes setting a compressor faster and more accurate. Most units display some mix of input level, output level and gain reduction, using needles, LED ladders or on-screen bars. This guide explains each meter type, what the numbers mean, and how to use them without letting them replace your ears.
What Compression Meters Measure

There are three readings you will see on most compressors:
- Input level: how hot the signal is before it reaches the gain stage. It helps you place the threshold.
- Output level: the level leaving the unit after makeup gain. It helps you avoid clipping the next stage and match levels for a fair comparison.
- Gain reduction: how many decibels the compressor is turning the signal down at any moment. This is the reading most engineers watch.
Gain reduction meters usually move in the opposite direction to level meters. On many hardware units the needle rests at 0 dB and swings left as the compressor works. On LED displays the bar often grows downward or from right to left. Either way, a reading of 4 dB means the signal is 4 dB quieter at that instant than it would be with the compressor bypassed.
Not all compression meters show all three readings at once. Some hardware units have a single switchable meter, so check which mode is selected before you trust the number.
VU Meters
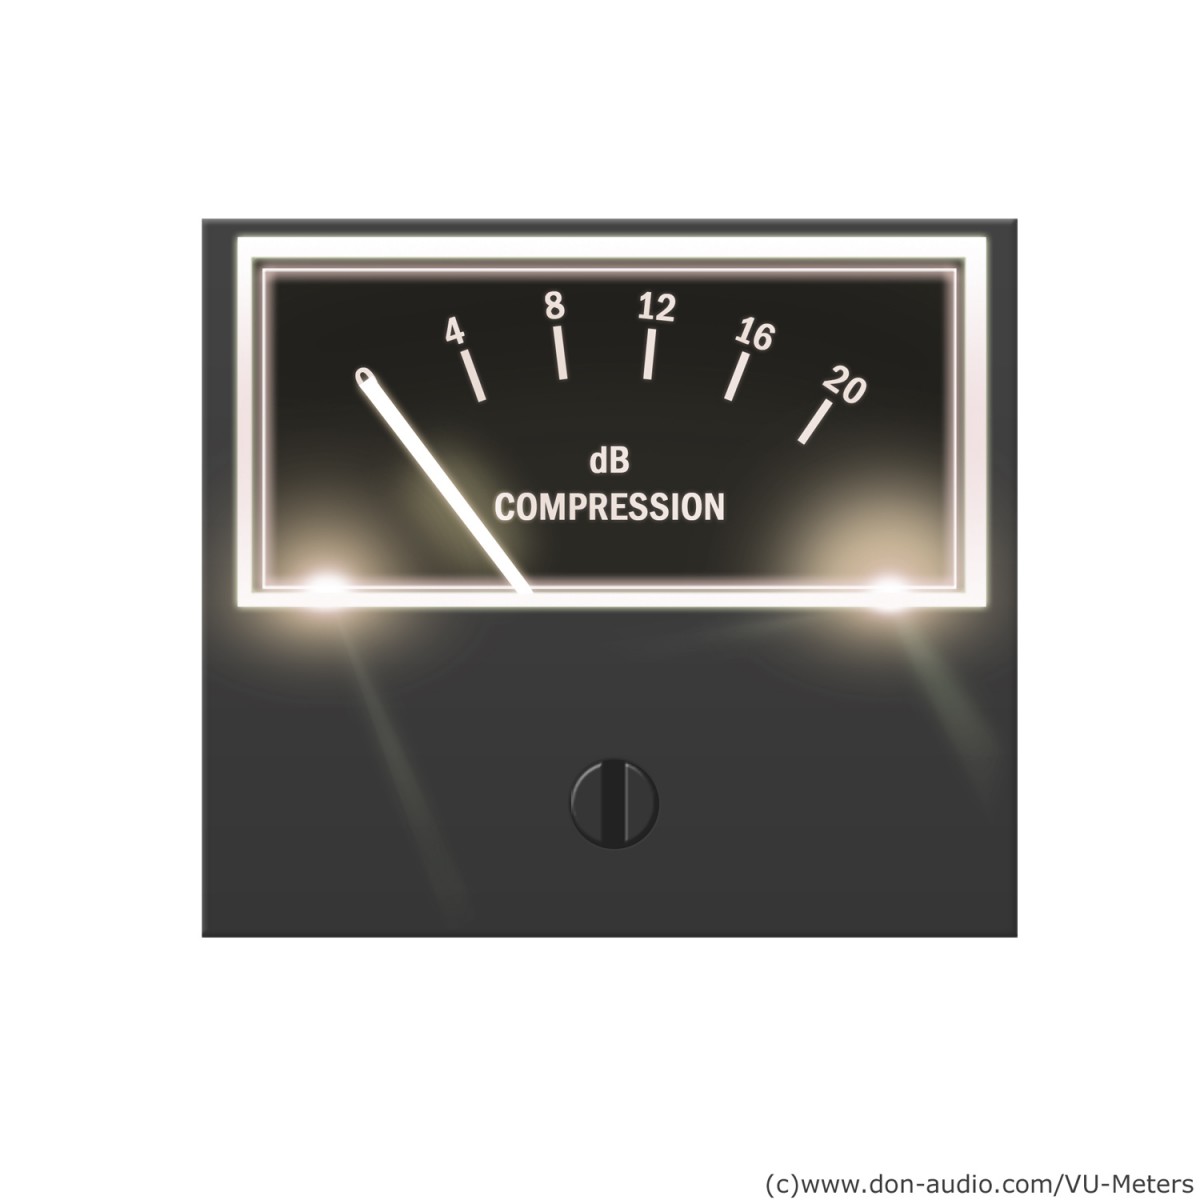
The volume unit meter was standardised for broadcast and telephone use in the late 1930s. It uses a needle with deliberately slow ballistics, specified to take about 300 milliseconds to reach its reading. Because of that, a VU meter shows something close to average loudness rather than true peaks. The Wikipedia entry on VU meters covers the standard and its history in more detail.
On a compressor, a VU-style gain reduction needle gives a smooth, musical picture of how hard the unit is working. It will not show every short peak, so a fast transient can be reduced more than the needle suggests. This is why classic hardware with VU needles is often set by ear first and then checked against the meter.
PPM and Peak Meters
Peak programme meters were developed to show short peaks more accurately. They rise quickly, typically with an integration time of around 10 milliseconds or less depending on the standard, and fall back slowly so the eye can read them. Digital peak meters in DAWs go further and show the highest sample value. When you need to know whether something will clip, a peak reading is the one to trust.
LED Ladder Meters
Many compressors use a column of LEDs, each lit at a fixed step such as 1, 2, 3, 5, 7, 10 and 20 dB. These meters respond quickly and are easy to read at a glance, but their resolution is coarse. If two adjacent steps are 3 dB and 5 dB, you cannot tell the difference between 3.5 and 4.5 dB. Use them to judge the general amount and movement of compression, not exact numbers.
Plugin Compression Meters
Software compressors usually give the most detailed displays. Common features include:
- Numeric peak hold: the largest gain reduction since playback began.
- Scrolling history: a graph showing input, output and gain reduction over the last few seconds, which makes it easy to see whether the unit recovers between hits.
- Transfer curve: a plot of input against output with a moving dot, which shows exactly where the signal sits relative to the threshold and knee.
- Switchable ballistics: options to show peak, RMS or VU-style readings on the same meter.
Plugin emulations of vintage gear often copy the original needle behaviour, so a modelled VU meter will be as slow as the real one.
How to Read Compression Meters While Setting a Compressor

- Watch the input meter and set the threshold so only the louder parts cross it.
- Watch the gain reduction meter on the loudest section. For gentle control, aim for 2 to 4 dB on peaks; for obvious character, 6 to 10 dB or more.
- Check the movement. The meter should rise on hits or loud words and fall back between them. A meter that stays pinned at one value usually means the release is too slow or the threshold too low.
- Use the output meter and makeup gain to match bypassed and processed levels, then compare by ear.
What the Meter Movement Tells You
The shape of the movement is often more useful than the number. A needle that snaps up on each snare hit and returns smoothly shows a compressor working with the groove. A needle that jitters rapidly on a bass part suggests the release is short enough to follow the waveform, which can cause distortion. A meter that barely returns before the next phrase points to gain reduction stacking up, which flattens the dynamics more than you may want.
Different detection modes also change what you see. A compressor reacting to peaks will show quick, spiky readings, while an RMS detector shows slower, broader movement. Our article on peak vs RMS compression explains how each mode hears the signal.
Typical Gain Reduction Ranges
- Mix bus glue: 1 to 3 dB.
- Lead vocal levelling: 3 to 6 dB, sometimes split across two compressors.
- Bass: 3 to 6 dB for steady notes.
- Drum bus: 2 to 5 dB.
- Parallel or room crush: 10 dB or more, blended in underneath the dry signal.
These are only guides. A sparse acoustic track may need far less, and an aggressive rock vocal may need more.
Common Metering Mistakes
- Comparing numbers across different units. Meter ballistics and scales vary, so 4 dB on one compressor may not look like 4 dB on another.
- Mixing with your eyes only. A healthy-looking meter does not guarantee a good sound.
- Ignoring the output. Heavy makeup gain can clip the next plugin or converter even when the gain reduction looks reasonable.
- Judging louder as better. Always level-match before deciding.
Final Thoughts
Compression meters are a map, not the destination. VU needles show the average feel, peak meters show what might clip, LED ladders give a fast overview, and plugin displays add history and transfer curves. Learn how your particular compressor’s meter behaves, use it to confirm what you hear, and you will set dynamics processing faster and with more confidence.